
Your everyday marketing decisions greatly impact leasing results. Do you feel confident about which marketing strategies are working or are you making choices based on gut instinct?
It often feels hard to pinpoint how your prospects convert and which strategies drive the leases in your community. This is a problem with your marketing attribution and reporting, not with you. If you don’t know what’s working, you don’t feel confident answering questions like “Should we cut spend during a pandemic, if so, where?” or “We got approved for a larger summer budget, where would this spend go the furthest?”. Let’s explore how Clarity, Journey Visualizer, and MatchBack reporting modules help to pinpoint the source of your leads and leases so you can make decisions with confidence.
Missing Pieces When Tracking Leads
The prospects’ journey is complex. Each apartment seeker has a unique journey and interacts with multiple marketing channels before converting. The big problem is that a lot of reporting modules grossly simplify your prospect’s journey. They take a journey with multiple steps and boil it down to just 1 step. This problem is found in both first touch and last-touch attribution. Here’s an example:
Actual Prospect Journey:
- Day 1: Clicks on a Facebook ad, visits site
- Day 3: Sees retargeting ad
- Day 8: Google’s your community and clicks on a Paid Search ad
- Day 12: Clicks on an Instagram ad, visits site
- Day 17: Google’s your community and visits your website from a Google My Business listing. Schedules a tour.
First Touch:
- Facebook drove this lead!
Last Touch:
- Google My Business drove this lead!
Having first touch and last touch data doesn’t make for confident decisions, it actually steers decisions off course. Let’s say you have last touch attribution, a pandemic strikes, and you are told to make cutbacks. Google My Business seems to be working, let’s cut Facebook. Oops, 30% of leases actually visited your website via a Facebook ad at some point in their journey, but the last touch did not show that! Now you lost a channel that engages an audience with high intent to lease.
You probably already guessed the solution to the problem: give credit to each of the sources that assisted in capturing the lead. We call this multi-touch attribution.
Multi-Touch in Action – Clarity Attribution Reporting
Multi-touch attribution combines data from each marketing channel that a prospect engages with, painting a more complete picture of your prospect’s journey. This level of insight helps you feel confident next time you make a strategic shift in your marketing game plan.
Clarity Attribution Reporting is a multi-touch attribution module by Conversion Logix. Clarity summarizes all of the avenues that a prospect takes to your website before converting into a lead. If a lead visited your website via a social ad one day, an organic search another day, and a Google My Business listing on a separate day, each of these channels would receive partial credit. In the example below, you can see that 31.9% of all leads interacted with a paid ad at some point in their journey.
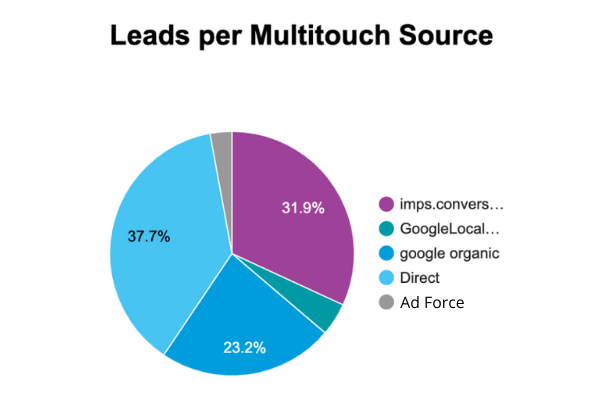
This multi-touch breakdown provided by Clarity is a powerful module to examine lead attribution from a high level. You can combine this insight with the first touch, last touch, and Journey Visualizer data to better understand the order your leads interact with each source. Journey Visualizer is a Conversion Logix module that exposes the exact journey each lead takes before converting, allowing you to drill down into the specific campaigns that produce leads.
Each Lead Has a Story – Journey Visualizer
The Journey Visualizer tells the story of how each lead found and interacted with your website before converting. This allows you to drill down into the specific campaigns that produce leads for your community. Here is an example:
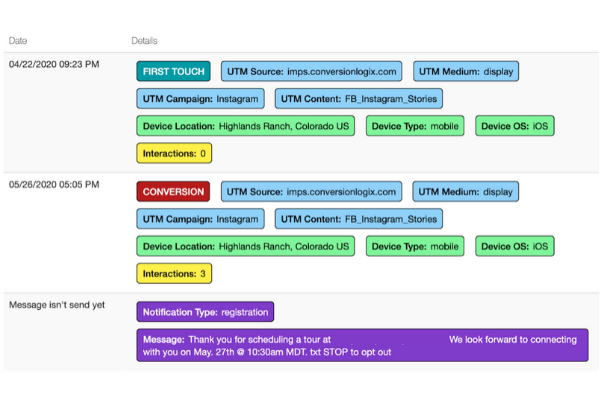
In the middle of quarantine, this prospect visited the community website for the first time, coming from an Instagram Stories ad. The prospect clicked on another Instagram Stories ad one month later and then scheduled a virtual tour for the property during that website visit. Where Clarity provided the high-level summary and lets you know which strategies to look at (paid advertising, organic searches, local listings, etc), Journey Visualizer allows you to dig deeper into each prospect’s journey and understand the various actions that produce leads. Understanding that prospects who come from Instagram Story ads are likely to convert is a valuable piece of information to use next time you change up your marketing mix.
Go Beyond the Lead – MatchBack Lease Attribution
Tracking where your leads come from is extremely important, but attributing actual leases helps you understand which campaigns drive your bottom line. Just like Clarity captures a high-level picture of the channels which drive leads, MatchBack shows you which campaigns drive leases. You can upload your rent roll to the MatchBack tool and gain powerful insights about your leads who went on to sign a lease. Here’s an example!

Be Confident
Your marketing decisions drive leasing performance and you need to feel confident while making those decisions. The best way to feel confident is to have a more detailed understanding of your prospects’ leasing journeys. Clarity, Journey Visualizer, and MatchBack paint that detailed picture of your historic leads and leases to make you feel confident in future decisions.
To learn more about Conversion Logix multi-touch lead and lease attribution, contact us today at info@clxmedia.com or schedule a consultation with a digital marketing professional by clicking here!